Long-term monitoring programmes face a recurring choice: how often to sample. Sampling too rarely may miss the dynamics that matter; sampling too often is expensive. We asked whether forecast skill itself can guide that choice, both in a controlled simulation and on a real lake.
Ecosphere
2024
PhD chapter 2
Sampling frequency and forecast skill
As sampling frequency drops, forecasts get worse for almost every class of a long lake-plankton record, and fewer interactions are recovered among the phytoplankton. Turn that around, and forecast skill becomes a design tool for monitoring programmes.
01 · The question
How often is often enough?
02 · What we did
A simulated baseline and a real high-frequency lake
We worked with two datasets. The first is a deliberately minimal baseline: a single simulated population following a delayed logistic equation, where the dynamics are known exactly and growth rate can be dialled up and down. The second is a high-frequency plankton record from Lake Greifensee, where an automated underwater camera images plankton every hour and neural-network classifiers sort the imaged individuals into phytoplankton and zooplankton. That gives six zooplankton classes; the phytoplankton we then split into six size bins.
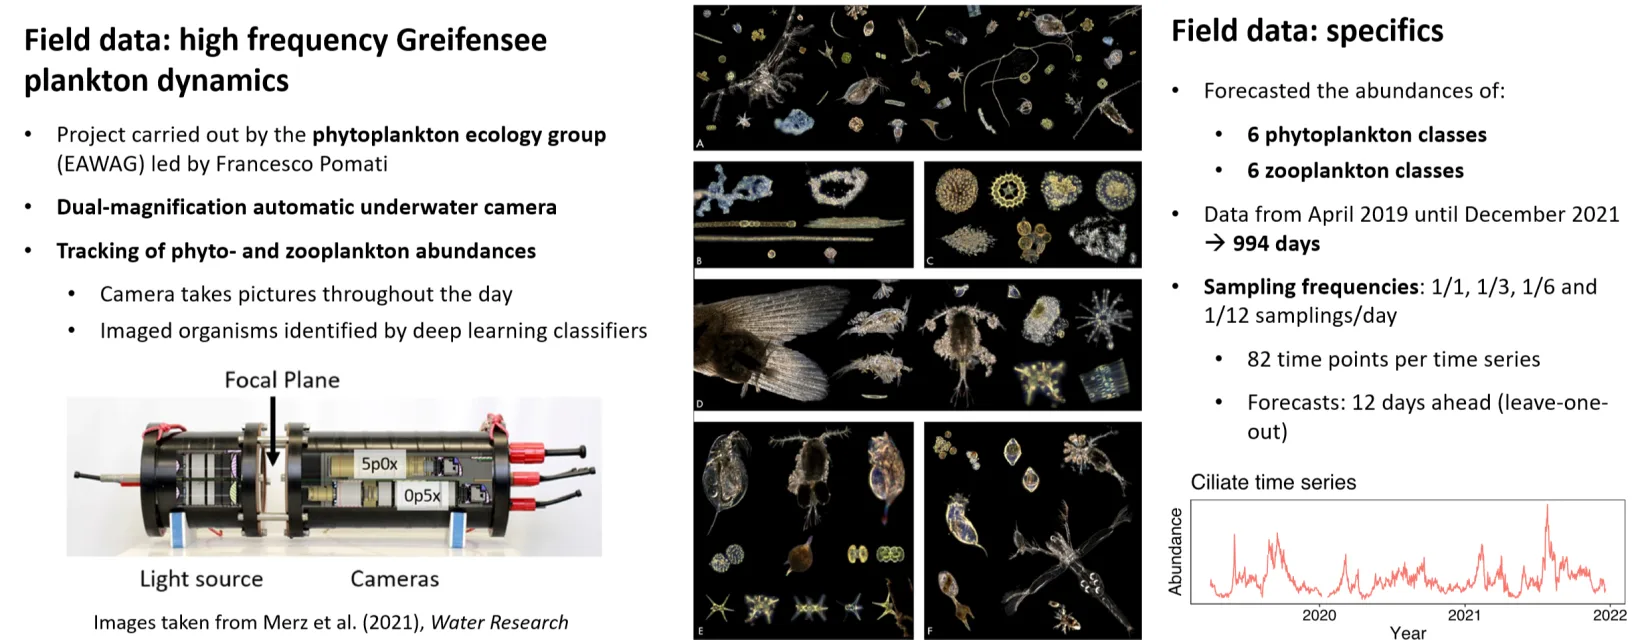
From the daily record we built sparser versions along two axes we kept deliberately apart: lower sampling frequency at a fixed 82 time points, down to one sample every twelve days, and fewer time points at daily frequency. At every setting we refit the forecasts, then used convergent cross-mapping to re-detect which classes were causally linked and S-map to re-estimate how strongly.
03 · What we found
Forecasts decay, and interaction estimates thin out
Forecast error rose as sampling grew sparser, for eleven of the twelve plankton classes; only the ciliates were forecast best from the sparsest series. Phyto- and zooplankton lost skill at much the same rate. Faster-growing classes were harder to forecast overall, though the evidence for that was weak.
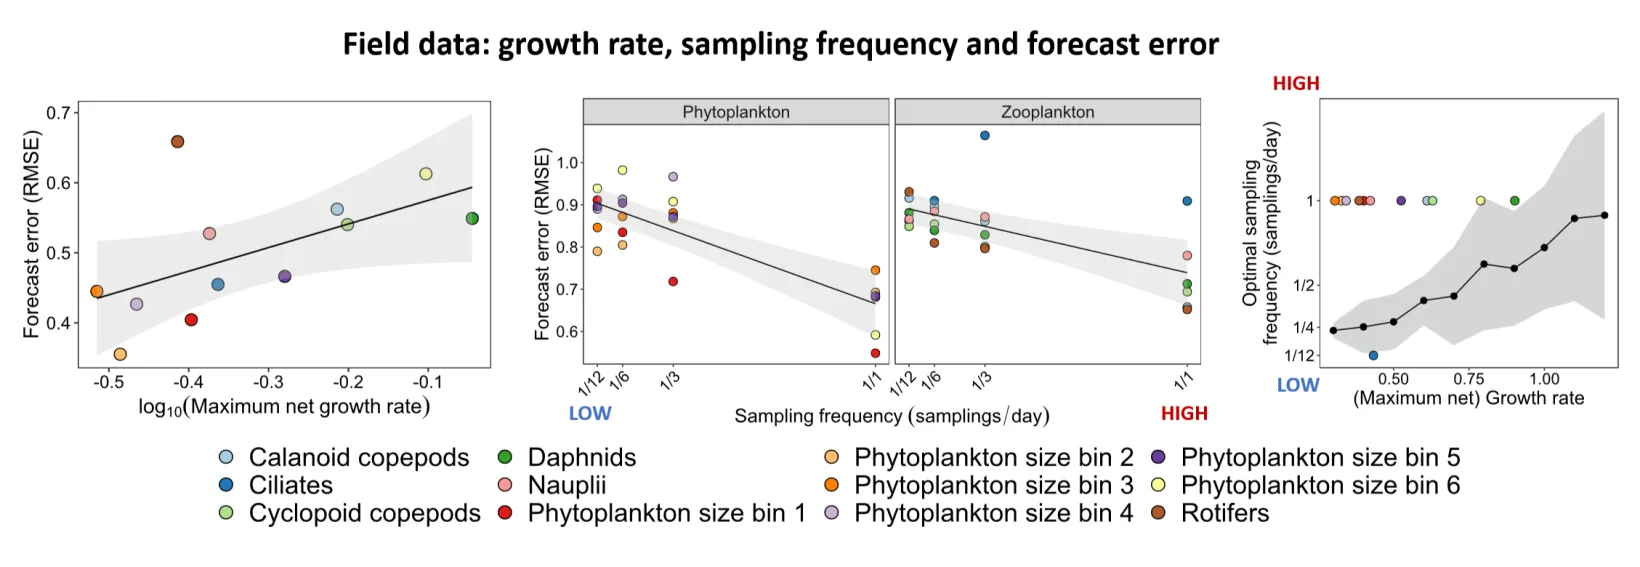
Frequency is informative, not just operational. Growth rate
predicted the right cadence in the single-species simulation. In the lake it
predicted nothing: the densest sampling available was the best for eleven of
twelve classes.
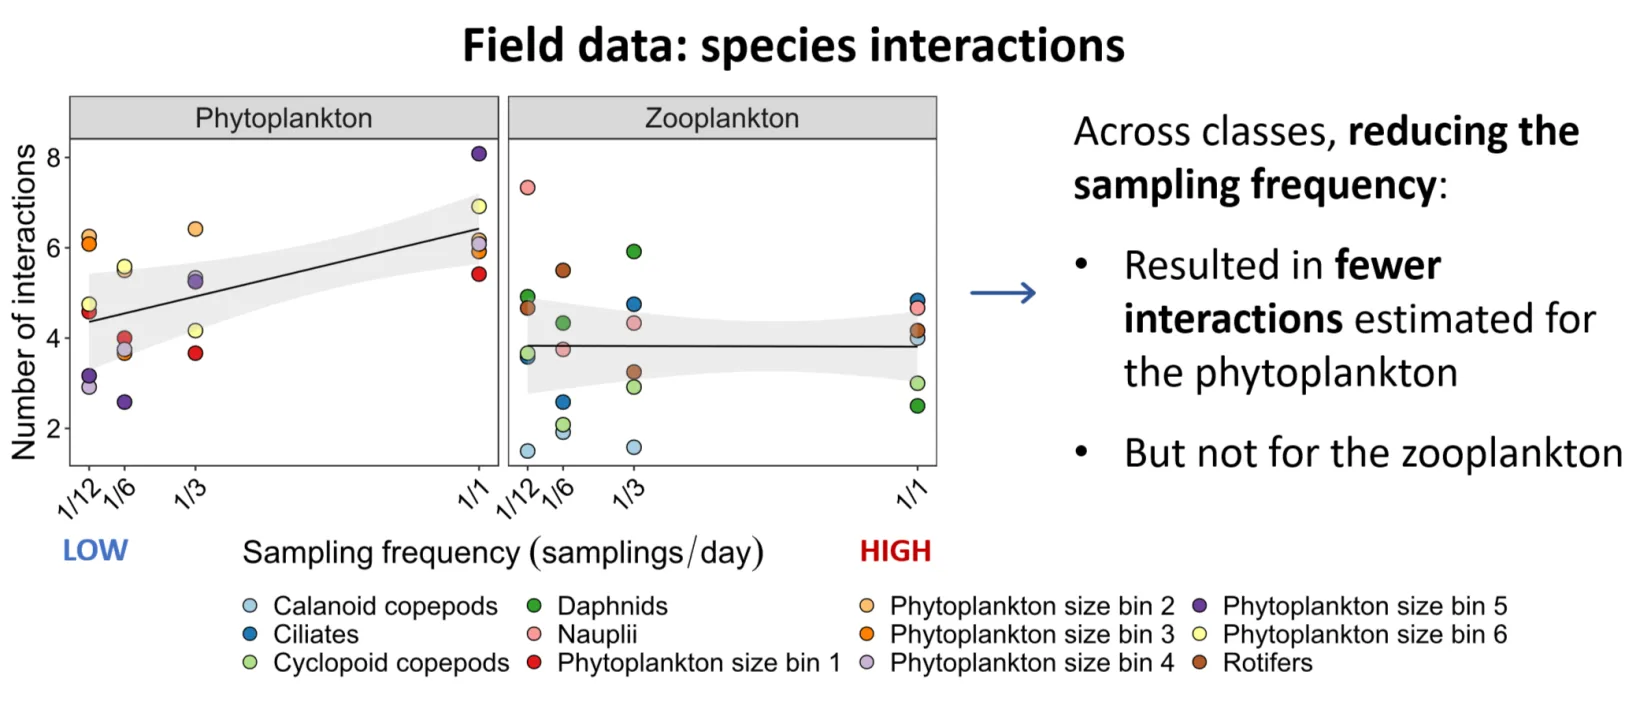
Sampling design also changed what the models said about who interacts with whom. Coarser sampling left fewer interactions detected among the phytoplankton classes, while the zooplankton estimates held on average, and mean interaction strength moved for neither group. The true interactions are unknown, so the bias cannot be measured directly. But since the forecasts were best at the densest sampling, the counts are likely closest to right there, and undercounts elsewhere.
Natural communities therefore seem to need denser sampling than a target’s own growth rate would suggest, plausibly because the cadence has to track the fastest variable a target interacts with, not the target itself.
04 · Why it matters
Forecast skill is a design tool, not just an outcome
Monitoring programmes can pilot their sampling cadence against forecast skill, choosing the lowest frequency that preserves both prediction and inference. That makes ecological monitoring cheaper to run, and the inferences drawn from it more honest: a programme that samples too rarely will not only forecast worse, it will also see a sparser interaction network than is really there.